ORIGINAL ARTICLE | https://doi.org/10.5005/jp-journals-10071-24089 |
Differentiating Cardiac and Pulmonary Causes of Dyspnea Using Ultrasonography and Dyspnea Discrimination Index
1,4,5Department of Emergency Medicine, Christian Medical College and Hospital, Vellore, Tamil Nadu, India
2Department of Medicine, Christian Medical College and Hospital, Vellore, Tamil Nadu, India
3Medical Intensive Care Unit, Christian Medical College and Hospital, Vellore, Tamil Nadu, India
Corresponding Author: Gina M Chandy, Department of Emergency Medicine, Christian Medical College and Hospital, Vellore, Tamil Nadu, India, Phone: +91 9894047479, e-mail: ginachandy@gmail.com
How to cite this article: Chandy GM, Sathyendra S, Pichamuthu K, Hazra D, Abhilash KPP. Differentiating Cardiac and Pulmonary Causes of Dyspnea Using Ultrasonography and Dyspnea Discrimination Index. Indian J Crit Care Med 2022;26(1):33–38.
Source of support: Nil
Conflict of interest: None
ABSTRACT
Background: One of the most common reasons for emergency room (ER) visits is acute dyspnea. The challenge is in differentiating a cardiac and pulmonary cause of acute breathlessness. Hence, we have studied the effectiveness of the dyspnea discrimination index (DDI) used in conjunction with ultrasonography (USG) in distinguishing between cardiac and pulmonary causes of dyspnea.
Methods: This was a prospective study conducted in the ER and general medicine wards to evaluate the efficacy of the DDI and USG in dyspneic patients. Data were entered in a standard data sheet and analysis was done using SPSS software.
Results: The majority of the patients were between the ages of 45 and 60, with a male predominance. Risk factors like smoking were more common in the pulmonary group (36%). Pulmonary cause of breathlessness was seen in 62% of patients and cardiac pathology was noted in 28%. The mean (SD) DDI value and DDI% are as follows: pulmonary group (DDI)—5.47 (SD: 2.82); cardiac group (DDI)—8.34 (SD: 3.75); pulmonary group (DDI%)—1.31 (SD: 0.68); cardiac group (DDI%)—2.34 (SD: 1.14). There was a significant difference in DDI% between the pulmonary and cardiac groups (p = 0.001). DDI was found to have a sensitivity and specificity of 77.3% and 70%, respectively. While for DDI%, sensitivity and specificity were 72.7% and 72%, respectively. Lung USG had 98% sensitivity and 95.5% specificity, with a narrow confidence interval. The positive likelihood ratio was noted to be 21.6, indicating a very high post-test probability.
Conclusion: The DDI and USG in conjunction had good discriminative power, when it came to distinguishing between cardiac and pulmonary causes of dyspnea. USG had a high specificity and sensitivity, making it suitable for identifying the cause of dyspnea in a tertiary care ER setting.
Keywords: Cardiac dyspnea, Dyspnea, Dyspnea Discrimination Index, Pulmonary dyspnea, Ultrasonography.
INTRODUCTION
One of the most common reasons for admission to a hospital’s emergency room (ER) is acute dyspnea. To establish a treatment strategy, ER physicians frequently need to make a quick and precise diagnosis.1,2 As the history and information pertaining to a patient given at presentation in ER are limited, differentiating a pulmonary and cardiac cause of dyspnea is difficult, and also the pathophysiology may not be well delineated by history and examination.1–3 As mostly sicker patients present to the ER, life can be lost due to a delay in making a clear diagnosis. Cardiac failure syndromes have a varied range of clinical symptoms and chest radiographs, electrocardiograms, and other biochemical and pathological laboratory tests accessible in the ER, which may delay the making of a diagnosis in such patients. Many bedside maneuvers and tests have been proposed in previous literature, with promising results.1–3 Apart from the patient’s history and clinical findings, rapid and trustworthy bedside tests are a cornerstone of diagnosis in the ER.
We chose to combine two ways to examine the same issue after a detailed literature review on relevant tools for determining the source of a pulmonary and cardiac cause of dyspnea.4–6 The key criteria were that the test should not be too time-consuming and that the sensitivity and specificity should be appropriate. The dyspnea discrimination index (DDI), which is the product of peak expiratory flow rate (PEFR) and partial pressure of oxygen divided by 1,000, and a multifactorial ultrasound (ultrasonography [USG]) screening tool were the two tests used.4–6 This index is simple to calculate, and obtaining a peak flow meter comes at a modest cost. The lung–cardiac inferior vena cava (LCI) screening approach was chosen because it was comprehensive, simple and only requires a simple portable ultrasound scanner. This device is designed to be a 3-minute evaluation test that aids in quick diagnosis.
In an Indian ER setting, neither the DDI nor the USG screening test had been studied earlier. Therefore, we conducted this study to see if these two bedside screening tools can help distinguish between a cardiac and a pulmonary cause of dyspnea in patients who report to the ER with abrupt onset of breathlessness.
METHODOLOGY
Design and Setting
This was a 1-year (May 2013–May 2014) prospective study conducted in the ER and medicine wards of Christian Medical College (CMC) Hospital, Vellore, a 2,700-bed tertiary care teaching hospital in South India.
Participants
Patients who presented to our ER with acute or persistent respiratory distress. These patients were thereafter followed up in the medical intensive care unit/ward till the time of discharge.
Inclusion Criteria
Patients who presented to the ER with new-onset or worsening of persistent dyspnea.
Age ≥18 years.
Exclusion Criteria
Patients who did not require hospitalization and were discharged from the ED.
Those who develop dyspnea due to a non-cardiac, non-pulmonary cause, such as trauma, intoxication, or muscle paralysis caused by a snake bite.
Patients who failed to perform a peak expiratory flow rate.
Patients who denied written consent for the study.
DDI Measurement
As soon as the patients were brought into the ER, they were made to blow maximally into the peak flow meter, and the readings were recorded. Three of these readings were taken, and the best of the three was used as the scoring tool. Nomogram values standardized for the Indian population were used to calculate the PEFR percentage, which was acquired from our hospital’s pulmonary function lab. Patients were excluded if they were unable to complete peak expiratory flowmetry or were too unwell to withhold oxygen until the measurement was taken. Before administering oxygen, an arterial blood gas (ABG) was taken, as a standard investigation for any breathless patients not only for our study but as the standard of care. The required values were taken from the ABG and noted in the standard abstract sheet. The patient’s height was recorded by either obtaining it from family if they were aware of it, or from previous hospital records if they were kept, or by measuring length using a measuring tape, which was the closest feasible estimate.
Screening of LCI
The LCI USG scan was done within the first few hours of initiation of therapy, by the primary investigator. A Sonosite M-Turbo® USG system was used for the same. Heart and lung USG and (inferior vena cava) IVC screening were all performed in a cardiac mode. The principal investigator was trained for the LCI USG and heart and lung USG by a professional before the initiation of the study. All scan images were saved, and 20% of them were cross-checked to ensure that the scans done by the principal investigator were legitimate.
Screening of Heart
The study subjects were first screened in a supine position in the ER. The heart was visualized in the parasternal long axis view after the probe was put in the second left intercostal space. The M-mode approach was used to calculate the ejection fraction (EF). We recorded video clips of cardiac contractility and saved a picture in the M-mode for calculation. The substernal view was used if seeing the heart from the second left intercostal space was difficult, as in patients with emphysematous lungs. The ejection fraction was not calculated in these types of cases, and contractility was estimated visually.
Screening of the Lungs
Lung USG was performed in six different positions. USG probe was used to evaluate the infraclavicular, mammary, upper and lower axillary, and upper and lower interscapular regions individually. All the subjects in the study had their entire lung screened using USG. A-lines, B-lines, consolidations (air bronchogram), lung sliding, comet tails, pleural effusions, and subpleural nodules were the findings noted.
Screening of IVC
The participants were also assessed for IVC screening at the same time. The IVC was first observed by putting the probe below the lower margin of the xiphisternum. The draining of hepatic veins into it, as well as its eventual entry into the right atrium, was used to identify it. The IVC’s variability with respiration was evaluated qualitatively, and an opinion on whether it was less than or more than 50% was recorded.
Sample Size Calculation
The sample size was determined by using the formula 4pq/d2. Sensitivity and specificity were reported to be 82 and 74%, respectively, in the previous literature. For the calculation of the 95% confidence interval (CI), the precision of the estimate (d) was taken at ±8. We generated a sample size of 115 patients using these values.
Quantitative Variables
PEFR% = (Measured peak expiratory flow rate/predicted peak expiratory flow rate) × 100
PaO2 = Partial pressure of oxygen as measured by ABG on room air
PaCO2 = Partial pressure of carbon dioxide as measured by ABG on room air
Left ventricular ejection fraction (LVEF) and inferior vena cava collapsibility—as per USG documentation
DDI = PEF × PaO2/1,000; DDI percent = PEFR% × PaO2/1,000
Statistical Analysis
PEFR, PEFR%, DDI, and DDI% were assessed for sensitivity, specificity, negative and positive predictive value, and likelihood ratio. A non-parametric test, the Wilcoxon rank-sum test, was performed to distinguish the variables in the two groups. The area under the curve for receiver operator characteristic (ROC) curves was determined. The sensitivity, specificity, and positive and negative predictive values of the USG LCI tool were evaluated using the ROC curve. Statistical Package for the Social Sciences (SPSS) for Windows software, version 23.0, Armonk, New York, USA, was used to analyze the data. For continuous data, mean (standard deviation) was used, and for nominal variables, frequencies and percentages were used.
Ethical Considerations
Before the initiation of the study, the institutional review board and its ethical committee gave their approval (IRB Min no: 8248 dated March 19, 2013). Unique IDs and password-protected data entry software with restricted users were used to guarantee patients’ confidentiality.
RESULTS
The ages between 45 and 60 years had the most participants, with a male preponderance. As shown in Table 1, more males came with pulmonary causes of dyspnea, while more females presented with a cardiac cause. The consort diagram of the study is given in Flowchart 1. Sixty-two percent of the patients had pulmonary causes and 28% had cardiac causes of dyspnea. When some of the risk variables connected with breathlessness were examined, it was noted that 36% of those who reported a pulmonary cause for breathlessness and 18% of those who presented with a cardiac cause for breathlessness were smokers. Prior cardiac disease was seen in 41% of individuals with cardiac causes of dyspnea, while lung disease was found in 42% of those with pulmonary causes of breathlessness. Diabetics made up a major portion of the study cohort. The heart dyspnea group had 59% of diabetics, while the pulmonary dyspnea group had just 28% of diabetics. Hypertensive patients made up 18% of the pulmonary group and 36% of the cardiac group. Other characteristics, such as presenting saturation, arterial blood gas pH, partial pressure of oxygen, and blood pressures at arrival were examined separately (Table 1).
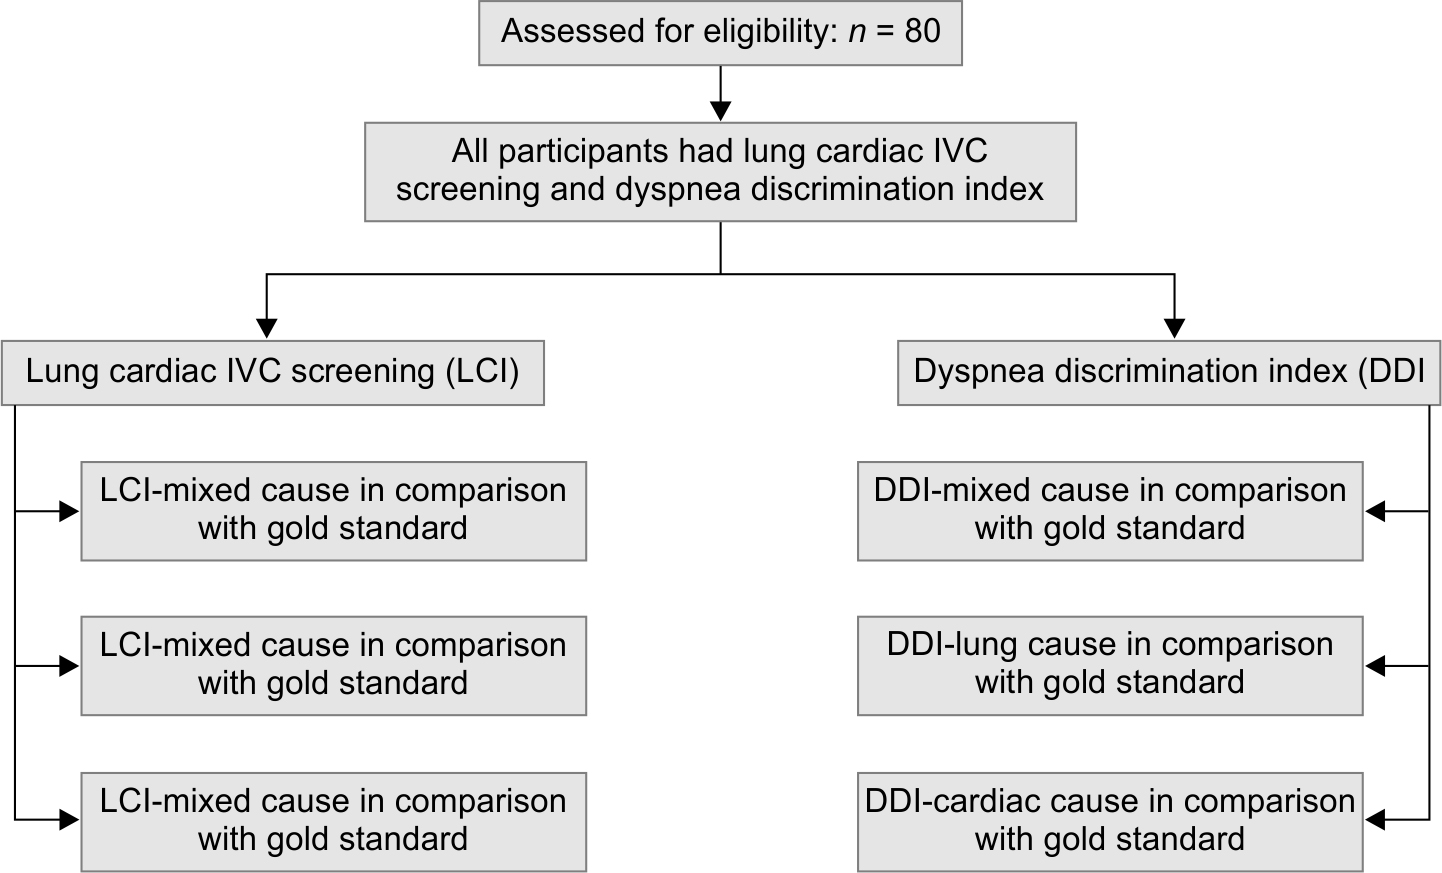
Flowchart 1: Consort diagram
| Variables | Pulmonary n = 50 (%) | Cardiac n = 22 (%) | Both n = 8 (%) |
|---|---|---|---|
| Age | |||
| <30 years | 9 (18) | 5 (22.7) | 0 (0) |
| 30–45 years | 9 (18) | 1 (4.5) | 2 (2.5) |
| 45–60 years | 15 (30) | 8 (36.36) | 3 (37.5) |
| >60 years | 17 (34) | 8 (36.36) | 3 (37.5) |
| Sex | |||
| Male | 36 (72) | 7 (31.8) | 4 (50) |
| Female | 14 (28) | 15 (68.18) | 4 (50) |
| Comorbidities | |||
| Smoker | 18 (36) | 4 (18) | 3 (37.5) |
| Diabetes mellitus | 14 (28) | 13 (59.1) | 3 (37.5) |
| Hypertension | 9 (18) | 8 (36.4) | 3 (37.5) |
| Heart disease | 4 (8) | 9 (41) | 3 (37.5) |
| Lung disease | 21 (42) | 1 (4.6) | 1 (12.5) |
| Vital signs | |||
| Systolic BP | 115.2 (SD:31) | 121.36 (SD:33) | 106.25 (SD:11) |
| Diastolic BP | 69.2 (SD:19) | 73.2 (SD:25) | 68.8 (SD:8) |
| O2 saturation level | 86.6 (SD:7) | 87 (SD:10.3) | 83.25 (SD:9.6) |
| pH | 7.41 (SD:0.09) | 7.38 (SD:0.11) | 7.37 (SD:0.07) |
The DDI was calculated, and a difference was noted between the cardiac and pulmonary groups (Table 2). In the pulmonary group, the mean value was 5.47 (SD: 2.82), while in the cardiac group, it was 8.34 (SD: 3.75), with a significant difference (p = 0.001). Similarly, the DDI% values in the pulmonary and the cardiac groups were 1.31 (SD: 0.68) and 2.34 (SD: 1.14), respectively, with a significant statistical difference (p = 0.001) (Table 3). As shown in Figure 1, ROC curves were drawn for the values and the best cutoffs were obtained. DDI had a sensitivity of 77.3% and a specificity of 70% while the DDI% had a sensitivity of 72.7% and a specificity of 72.0%. The negative predictive value, positive predictive value, and likelihood ratios of these variables are given in Table 3. The overall diagnostic accuracy is demonstrated in Figure 2. The specificity of lung USG was 95.5% with a positive likelihood ratio of 21.6, indicating a high post-test probability, whereas the sensitivity was 98% with a narrow confidence interval (Table 3). Lung USG also had a high positive and negative predictive value of 98 and 95.5%, indicating that it might be utilized in the ER to differentiate between cardiac and pulmonary causes of dyspnea.
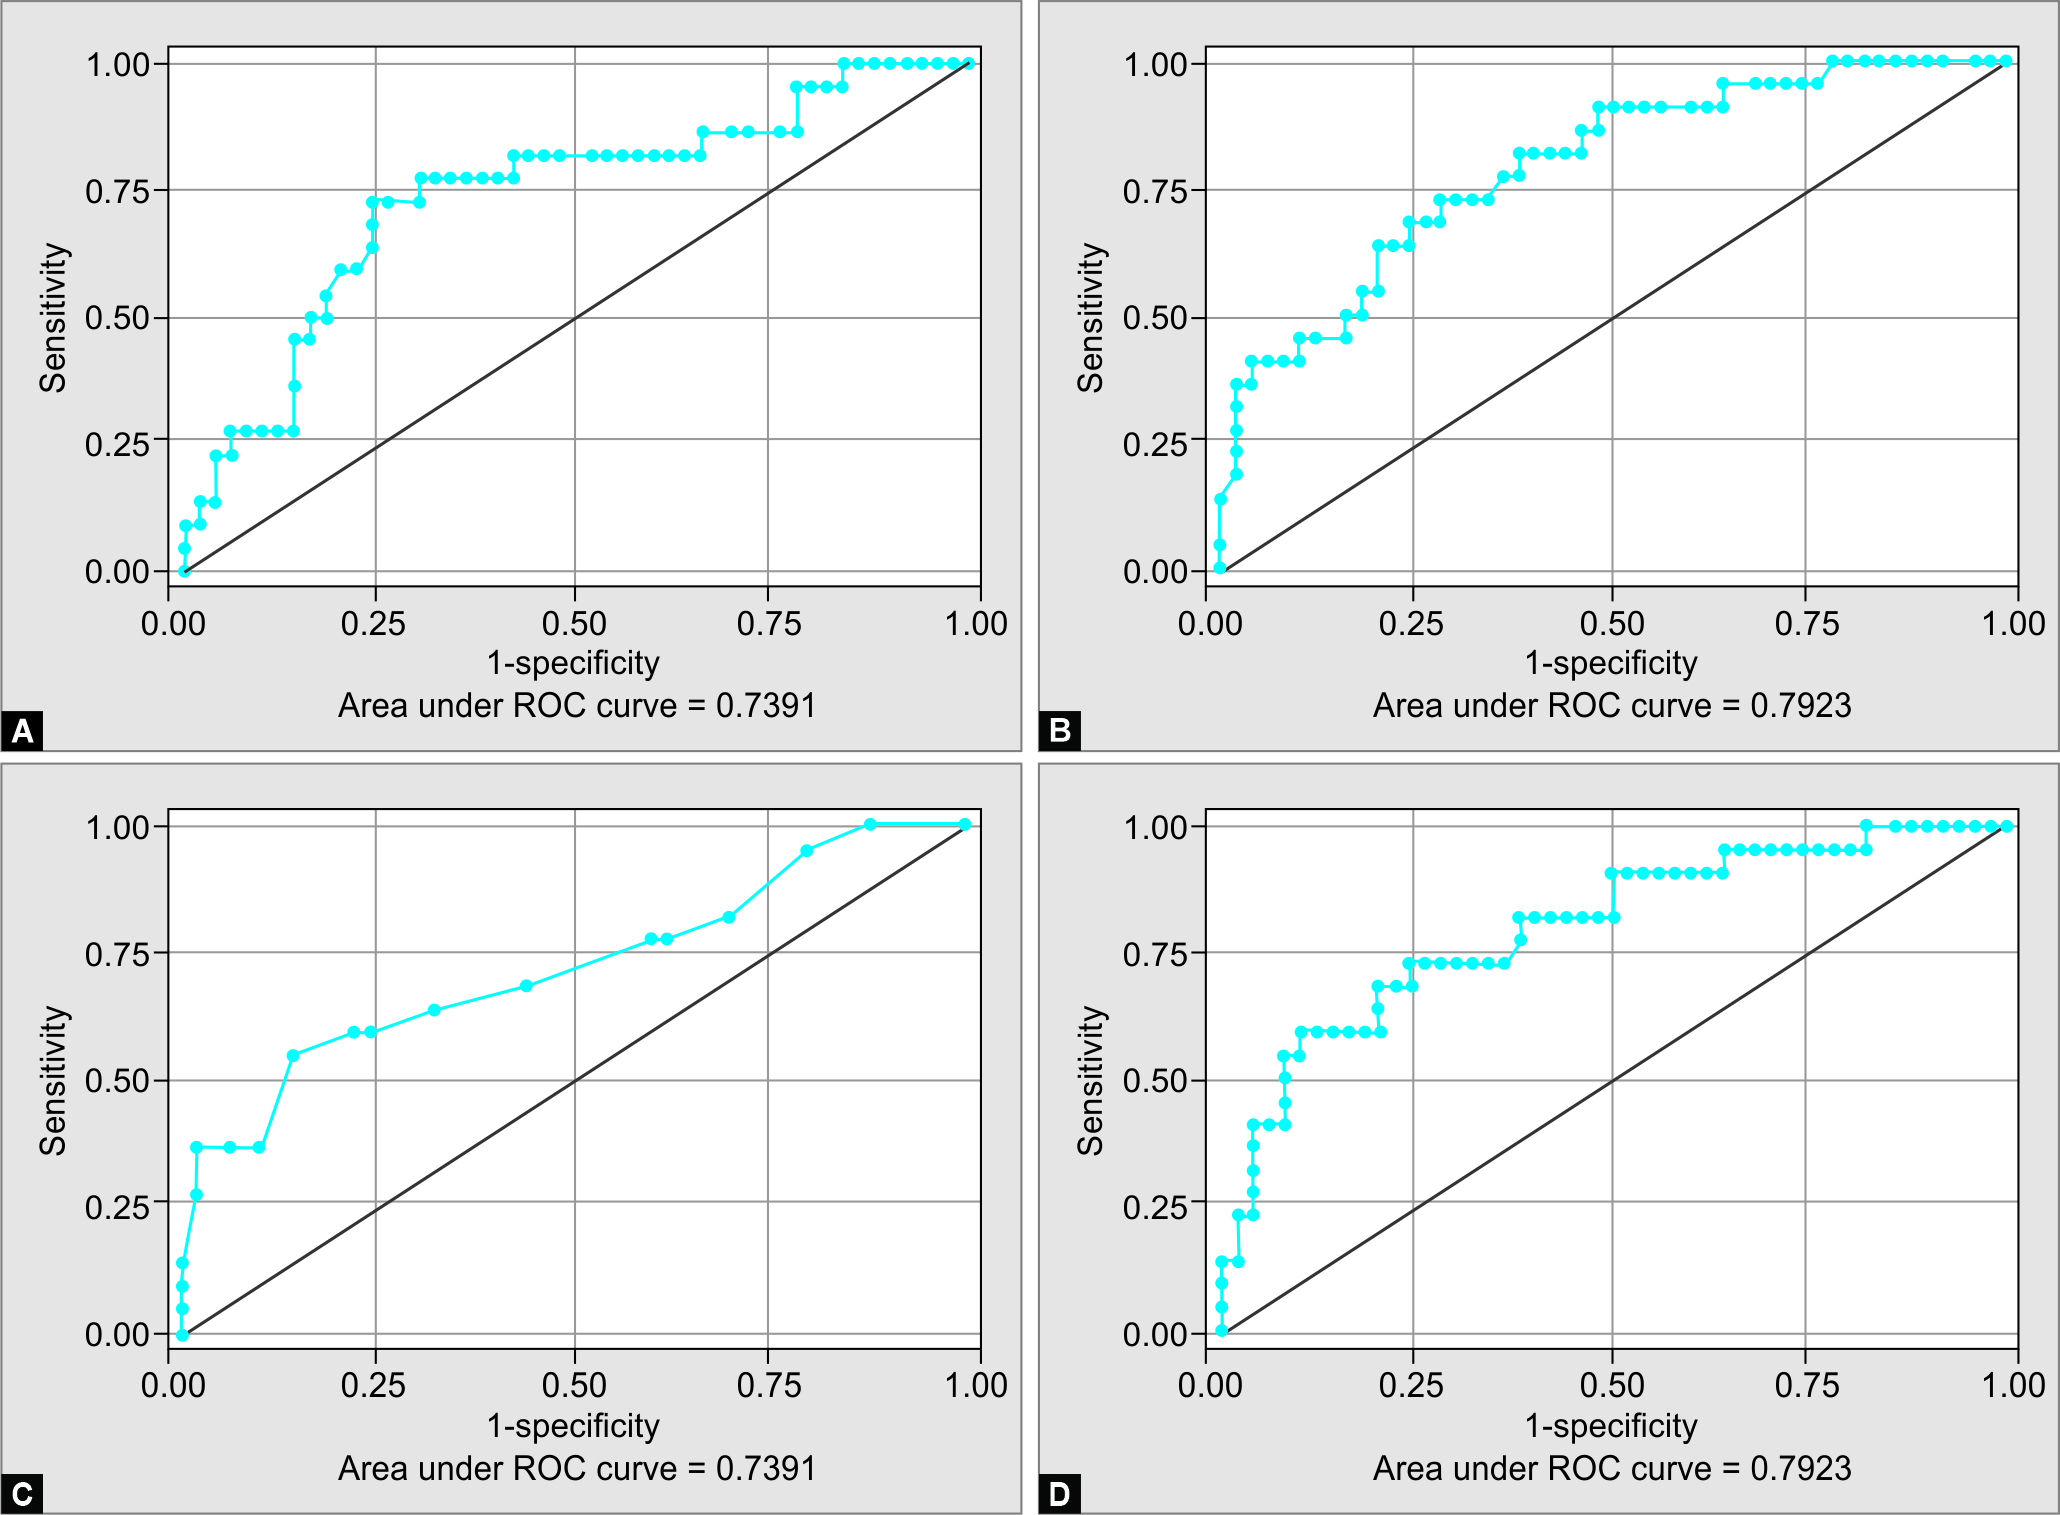
Figs 1 A to D: ROC curves

Fig. 2: Diagnostic accuracy graph
| Variables | Pulmonary dyspnea Mean (SD) | Cardiac dyspnea Mean (SD) | p value |
|---|---|---|---|
| Dyspnea discrimination index (DDI) | 5.47 (2.82) | 8.34 (3.75) | 0.001 |
| DDI% | 1.31 (0.68) | 2.34 (1.14) | 0.001 |
| pCO2 | 37.64 (13.74) | 35.77 (11.07) | 0.75 |
| pO2 | 52.72 (11.75) | 58.77 (15.19) | 0.06 |
| Peak expiratory flow rate (PEFR) | 101.80 (37.51) | 145.0 (58.70) | 0.003 |
| PEFR% | 24.38 (10.72) | 40.67 (16.82) | 0.001 |
| Variables | Sensitivity | Specificity | Likelihood ratio +ve | Likelihood ratio −ve | Positive predictive value | Negative predictive value |
|---|---|---|---|---|---|---|
| PEFR | 59.1 | 78 | 0.685 | 2.69 | 54.2 | 81.3 |
| PEFR% | 72.7 | 76 | 3.03 | 0.359 | 57.1 | 86.4 |
| DDI | 77.3 | 70 | 2.58 | 0.325 | 53.1 | 87.5 |
| DDI% | 72.7 | 72 | 2.6 | 0.379 | 53.3 | 85.7 |
| Lung ultrasound | 98 | 95.5 | 21.6 | 0.021 | 98 | 95.5 |
DISCUSSION
Breathlessness is a widespread issue that affects people of all ages. According to an Australian poll, 11.1% of the 5,331 adults questioned felt dyspnea, with 3.4% having an Medical Research Council grading of II–IV.7 Breathlessness was reported by 21% of patients in a similar study conducted in an ER.8 This is the first study done in India to compare measures like DDI, DDI%, and lung USG in the ER to distinguish between pulmonary and cardiac causes of acute-onset dyspnea. This study looked at two distinct approaches for assessing breathlessness at the bedside. Previous studies have shown that a combination of peak flow meters and oxygen partial pressure measurements helps in distinguishing patients with cardiac and pulmonary causes of dyspnea.9,10 Hence, we postulated that it would have an additive impact on diagnostic accuracy when used together. We checked out each parameter including blood pressure, room air oxygen saturation, pH (ABG), and PaO2 (ABG) at arrival that was almost the same in the two groups, with variation primarily based on the severity of dyspnea and underlying disease pathology.
In this study, we assessed DDI and DDI% and noted a decent difference between the two groups. Using the most effective cutoffs, sensitivity and specificity of DDI and DDI% ROC curves were drawn as mentioned in the results. A study done in Cleveland using these tools showed poor diagnostic accuracy. However, in our study population, the diagnostic accuracy was 82.5%, which could be explained by the fact that only senior ER registrars along with qualified ER physicians with good clinical knowledge and experience were posted in priority one and two of our ER.
Other entities were tested individually using the Wilcoxon rank-sum test to check if their discriminatory ability had any statistical significance. PEFR was shown to be insufficiently sensitive on its own, whereas PEFR% was more sensitive and specific. None of these numbers was adequate to be employed in the ER as a tool to increase diagnostic accuracy. However, because of the scoring tool’s benefits, we may suggest its utilization in a peripheral setting with limited resources and cost restrictions. One issue they might confront is the need for a blood gas analyzer, which may not be available at a remote location. Also, when comparing the sensitivity and specificity of the individual values of the score, it is clear from our study that the PEFR% is extremely good on its own and may be used instead of the DDI tool as the difference in sensitivity is negligible.
Only two USG diagnoses in this study sample were incorrect. As a result, the specificity was 95.5% and the sensitivity was 98%. These findings were similar to a study done by Kajimoto using this screening method.11 A-lines, B-lines, and an air bronchogram are straightforward imaging findings that may be taught to any ER clinician. The determination of the EF is a little more complicated measurement, but it may also be learned through brief USG training sessions as it can be visually approximated after some scanning experience. This tool will be best used in tertiary and secondary care ER settings where diagnostic accuracy of patients with dyspnea can be enhanced to nearly 100%. There may not be an X-ray machine in some peripheral or secondary care medical setups; however, an USG machine is often available which is used for obstetric purposes. Therefore, an USG, which is less expensive than putting up an X-ray facility, can assist in bridging that gap in lung and cardiac imaging.
In India, no research has looked at cardiac assessments for dyspnea using USG in the ER. This is astonishing as echocardiography were more commonly used than a lung USG in evaluating these cases. These techniques have been underutilized in an ER setup, and it is this understanding that has prompted Western countries into USG assessment methods in evaluating these patients.12,13 They eventually combined lung and heart ultrasound to get the best diagnostic results. Following a thorough literature review and our research, we believe that this protocol (Flowchart 2) can be utilized in the ER to evaluate patients with acute or chronic respiratory problems.

Flowchart 2: USG—Algorithm to look for causes of breathlessness in the ED
Limitations
Better findings would have been obtained with a bigger sample size and more patients tested in each group.
Suggestions for Future Research
Studies examining the LCI score in patients with valvular heart defects may improve the diagnostic accuracy of the suggested USG scan. However, the evaluation should compare the new tool to the current LCI screen to evaluate if there is a time and learning curve benefit. The DDI could be used as a first-line evaluation in ambulance units that provide urgent care to patients before transporting them to the hospital. It could be beneficial in the planning stage of therapy.
Clinical Application
The tools investigated are beneficial in two different scenarios: In a rural or remote health care context, the DDI will aid in determining the source of breathlessness and, as a result, early intervention will be possible. USG screening, on the other hand, is a beneficial tool in a tertiary care setting since it can provide a precise and prompt diagnosis so that proper therapy can be started right away.
CONCLUSION
These bedside tools have a high degree of discrimination between cardiac and pulmonary causes of dyspnea in ER. As our center’s diagnostic accuracy is high, the DDI score may not be useful in further separating the causes of dyspnea. The USG tool, on the other hand, has high sensitivity and specificity, making it perfect for usage in a tertiary care emergency room to pinpoint the particular reason for dyspnea.
Research Quality and Ethics Statement
The authors of this manuscript declare that this scientific work complies with reporting quality, formatting, and reproducibility guidelines set forth by the EQUATOR Network. The authors also attest that this clinical investigation was determined to require institutional review board/ethics committee review, and the corresponding protocol/approval number is IRB Min no: 8248 dated March 19, 2013. We also certify that we have not plagiarized the contents in this submission and have done a plagiarism check.
ORCID
Gina M Chandy https://orcid.org/0000-0002-3046-4418
Sowmya Sathyendra https://orcid.org/0000-0002-9443-0022
Kishore Pichamuthu https://orcid.org/0000-0002-6977-1183
Darpanarayan Hazra https://orcid.org/0000-0002-5941-0587
Kundavaram PP Abhilash https://orcid.org/0000-0002-2382-4411
REFERENCES
1. Woollard M, Greaves I. 4 Shortness of breath. Emerg Med J 2004;21(3):341–350. DOI: 10.1136/emj.2004.014878.
2. Ray P, Birolleau S, Lefort Y, Becquemin M-H, Beigelman C, Isnard R, et al. Acute respiratory failure in the elderly: etiology, emergency diagnosis and prognosis. Crit Care 2006;10(3):R82. DOI: 10.1186/cc4926.
3. Dyspnea. Am J Respir Crit Care Med 1999;159(1):321–340. DOI: 10.1164/ajrccm.159.1.ats898.
4. McNamara RM, Cionni DJ. Utility of the peak expiratory flow rate in the differentiation of acute dyspnea. cardiac vs pulmonary origin. Chest 1992;101(1):129–132. DOI: 10.1378/chest.101.1.129.
5. Malas O, Cağlayan B, Fidan A, Ocal Z, Ozdoğan S, Torun E. Cardiac or pulmonary dyspnea in patients admitted to the emergency department. Respir Med 2003;97(12):1277–1281. DOI: 10.1016/j.rmed.2003.07.002.
6. Ailani RK, Ravakhah K, DiGiovine B, Jacobsen G, Tun T, Epstein D, et al. Dyspnea differentiation index: a new method for the rapid separation of cardiac vs pulmonary dyspnea. Chest 1999;116(4):1100–1104. DOI: 10.1378/chest.116.4.1100.
7. Seif D, Perera P, Mailhot T, Riley D, Mandavia D. Bedside ultrasound in resuscitation and the rapid ultrasound in shock protocol. Crit Care Res Pract 2012;2012:503254. DOI: 10.1155/2012/503254.
8. Pearson SB, Pearson EM, Mitchell JR. The diagnosis and management of patients admitted to hospital with acute breathlessness. Postgrad Med J 1981;57(669):419–424. DOI: 10.1136/pgmj.57.669.419.
9. Berliner D, Schneider N, Welte T, Bauersachs J. The differential diagnosis of dyspnea. Dtsch Arztebl Int 2016;113(49):834–845. DOI: 10.3238/arztebl.2016.0834.
10. Raffin TA, Theodore J. Separating cardiac from pulmonary dyspnea. JAMA 1977;238(19):2066–2067. PMID: 578913.
11. Kajimoto K, Madeen K, Nakayama T, Tsudo H, Kuroda T, Abe T. Rapid evaluation by lung-cardiac-inferior vena cava (LCI) integrated ultrasound for differentiating heart failure from pulmonary disease as the cause of acute dyspnea in the emergency setting. Cardiovasc Ultrasound 2012;10(1):49. DOI: 10.1186/1476-7120-10-49.
12. Manson W, Hafez NM. The rapid assessment of dyspnea with ultrasound: RADiUS. Ultrasound Clin 2011;6(2):261–276. DOI: 10.1016/j.cult.2011.03.010.
13. Goffi A, Pivetta E, Lupia E, Porrino G, Civita M, Laurita E, et al. Has lung ultrasound an impact on the management of patients with acute dyspnea in the emergency department? Crit Care 2013;17(4):R180. DOI: 10.1186/cc12863.
________________________
© The Author(s). 2022 Open Access This article is distributed under the terms of the Creative Commons Attribution 4.0 International License (https://creativecommons.org/licenses/by-nc/4.0/), which permits unrestricted use, distribution, and non-commercial reproduction in any medium, provided you give appropriate credit to the original author(s) and the source, provide a link to the Creative Commons license, and indicate if changes were made. The Creative Commons Public Domain Dedication waiver (http://creativecommons.org/publicdomain/zero/1.0/) applies to the data made available in this article, unless otherwise stated.