ORIGINAL ARTICLE |
https://doi.org/10.5005/jp-journals-10071-24157 |
Ventilator-associated Events Surveillance in a Trauma Intensive Care Unit: A Prospective Study of Incidence, Predictive Values, Sensitivity, Specificity, Accuracy, and Concordance with Ventilator-associated Pneumonia
1Medical Microbiology, Infection Control, Nursing, Postgraduate Institute of Medical Education and Research, Chandigarh, India
2Anesthesia and ICU, Postgraduate Institute of Medical Education and Research, Chandigarh, India
3Medical Microbiology, Infection Control, Scrubtyphus, Postgraduate Institute of Medical Education and Research, Chandigarh, India
4Nursing, Postgraduate Institute of Medical Education and Research, Chandigarh, India
Corresponding Author: Kajal Jain, Anesthesia and ICU, Postgraduate Institute of Medical Education and Research, Chandigarh, India, Phone: 01722756500, e-mail: kajalteji@gmail.com
How to cite this article: Kaur K, Jain K, Biswal M, Dayal SK. Ventilator-associated Events Surveillance in a Trauma Intensive Care Unit: A Prospective Study of Incidence, Predictive Values, Sensitivity, Specificity, Accuracy, and Concordance with Ventilator-associated Pneumonia. Indian J Crit Care Med 2022;26(5):584–590.
Source of support: Nil
Conflict of interest: None
ABSTRACT
Introduction: The Centres for Disease Control and Prevention (CDC) introduced a new definition of ventilator-associated events (VAEs) in 2013 in place of longstanding ventilator-associated pneumonia (VAP) definition. Three entities under VAE, ventilator-associated condition (VAC), infection-related ventilator-associated complication (IVAC), and possible ventilator-associated pneumonia (PVAP), were introduced.
Objectives: To assess the incidence of all VAEs in a tertiary care trauma ICU and to find the predictive value of VAE and sensitivity of VAE definitions for VAP.
Design: Cohort prospective study at trauma intensive care unit (ICU) of PGIMER, Chandigarh, from July 2018 till June 2019.
Materials and methods: Patients admitted in trauma ICU were checked for VAP and VAE criteria defined by CDC.
Results: Four hundred and sixty five patients were observed. Around 378 patients were included in the study with 4046 patient days and 3031 mechanical ventilation (MV) days. Incidence rate of PVAP, IVAC, VAC, and VAP was 2.97, 6.60, 10.23, and 9.24 per 1000 ventilator days, respectively. Sensitivity, specificity, positive predictive value, and negative predictive value (NPV) of diagnosing VAP were 0.61, 0.97, 0.68, and 0.97 for VAC; 0.80, 0.97, 0.57, and 0.99 for IVAC; and 0.78, 0.94, 0.25, and 0.9 for PVAP, respectively. Kendall’s W test showed that there was very poor concordance between VAP and VAE.
Keywords: Infection-related ventilator-associated complication, Possible ventilator-associated pneumonia, Ventilator-associated condition, Ventilator-associated events, Ventilator-associated pneumonia.
INTRODUCTION
The Centres for Disease Control and Prevention (CDC) introduced a new definition of ventilator-associated events (VAEs) in 2013 in place of the earlier definition of ventilator-associated pneumonia (VAP). The three tiers included under VAE were ventilator-associated condition (VAC), infection-related ventilator-associated complication (IVAC), and possible ventilator-associated pneumonia (PVAP). This was done to simplify surveillance, increase objectivity, and broaden prevention efforts.
Trauma patients are at high risk of VAP as compared to non-trauma patients.1–4 Magill et al. analyzed data reported from U.S. healthcare facilities for VAEs that occurred in 2014.4 They found substantial variability in VAE incidence and in the proportions of VAE characterized as infection-related, and ventilator utilization within and among location types. It therefore becomes a critical issue to work on a surveillance definition closely related to the clinical pneumonia. Apart from accuracy, other important factors are sensitivity, specificity, and predictive values of the surveillance tests. Piriyapatsom et al. evaluated infection-related VAE algorithm for VAP in their surveillance in a trauma population at Massachusetts. They reported that IVAC criteria had poor sensitivity and positive predictive value (PPV) for the diagnosis of VAP according to the 2008 CDC/NHSN definition.5
In India, the adoption of VAE surveillance is still limited. There are no published studies on the same. One of the reasons of limited work on VAE is the uncertainty about possible overlap with the VAP definition. It is important to determine the impact of VAP episodes missed by VAE surveillance and vice versa. The objective of the present study is to determine the incidence of all VAEs and VAP in a tertiary care trauma intensive care unit (ICU) and to determine the predictive values, sensitivity, specificity, and accuracy of VAE definitions for detection of VAP.
MATERIALS AND METHODS
Design
A prospective study was done at the Trauma ICU of PGIMER, Chandigarh, from July 2018 till June 2019.
Inclusion and Exclusion Criteria
All the patients who were admitted in the Trauma ICU and mechanically ventilated for more than two days were recruited in the study. The patients who were not mechanically ventilated or mechanically ventilated for less than 2 days or organ donors were excluded from the surveillance.
Data Collection
The data collection forms were made and finalized by the study group. One dedicated infection control nursing officer visited the ICU every day at same time of the day for data collection. The denominator data were collected for all the patients present at the Trauma ICU. The patients were prospectively followed up for the development of VAP (NHSN definition) and VAEs (Flowchart 1 and Table 1) based on criteria defined by CDC. Daily monitoring of positive-end expiratory pressure (PEEP), fraction of inspired oxygen (FiO2), fever, total leukocyte count, mental status deterioration, increase in volume and change in character of secretions, tachypnea, bronchial breath sounds, worsening gas exchange, and progressive or new infiltrates/consolidation/cavitation, along with new antibiotics and positive microbiology cultures. All the patients who fit into the criteria of VAP and VAE were recognized and discussed with the study group and included in numerator data.

Flowchart 1: Ventilator-associated events (VAE) surveillance algorithm
For ANY PATIENT, at least one of the following:
|
And at least two of the following:
|
| Two or more serial chest imaging test results with at least one of the following: |
| New and persistent |
| or |
Progressive and persistent
|
Statistical Analysis
Kendall’s coefficient of concordance was calculated using the Statistical Package for Social Sciences software version 20 to find the agreement between VAE (VAC, IVAC, and PVAP) and VAP. MEDCALC statistical software was used to calculate the PPV, NPV, sensitivity, specificity, and accuracy of the VAE (VAC, IVAC, and PVAP) for the diagnosis of VAP.
RESULTS
Five hundred and nine admissions were enrolled over a period of 1 year in the trauma ICU. One hundred and thirty-one patients were excluded from the study. Three hundred and seventy-eight patients who were mechanically ventilated for more than two days were recruited as study population for surveillance of VAP and VAE. The majority of patients were male (76.2%) and around 70% of the patients were less than 40 years of age without any co-morbidity. Most of them (73.3%) were received after average 2–3 days stay in emergency unit and 50% of the patients were intubated either in emergency or outside PGIMER (Table 2). The total patient days in the study were 4046 and mechanical ventilation days were 3031. The MV utilization ratio was 0.75. Out of total study population 40 (10.6%) patients developed VAE and/or VAP-NHSN (Table 3). The incidence of VAC ranged from 0 to 24 in 12 months with a peak in April (20), while that of VAP ranged from 0 to 18.96 with a peak in March (9.48) (Fig. 1). The mortality was 21.4% overall, 66.7% in patients who developed VAP and 73.4% in those with VAC (Table 2).
| Categories | Number (%) | |
|---|---|---|
| Admission units | Neurosurgery Orthopedics Others |
264 (69.8) 43 (11.4) 71 (18.8) |
| Gender | Male Female |
288 (76.2) 90 (23.8) |
| Age (years) | <18 19–40 41–60 >61 No data |
84 (22.2) 183 (48.4) 76 (20.1) 22 (5.8) 13 (3.4) |
| Previous unit | Emergency Ward No data |
277 (73.3) 76 (20.1) 25 (6.6) |
| Intubation | Before ICU admission Intubated inside ICU |
189 (50) 189 (50) |
| End status | Expired LAMA* Transferred to another unit |
81 (21.4) 10 (2.6) 287 (76) |
| Trauma with head injury | Yes No No data |
231(61.1) 84 (22.2) 63 (16.7) |
| Comorbidity** | Present Not present No data |
27 (7.1) 181(47.9) 170 (45) |
| Entity | Number (%) (N = 378) | Incidence per 1,000 MV days (MV days = 3031) |
|---|---|---|
| VAP | 28 (7.41) | 9.24 |
| VAC/VAE | 31 (8.20) | 10.23 |
| IVAC | 20 (5.29) | 6.60 |
| PVAP | 9 (2.38) | 2.97 |
| VAP but no VAE | 9 (2.38) | 2.97 |
| VAC but no VAP | 12 (3.17) | 3.96 |
| IVAC but no VAP | 4 (1.06) | 1.32 |
| PVAP but no VAP | 2 (0.53) | 0.66 |
| Both VAC and VAP | 19 (5.02) | 6.26 |
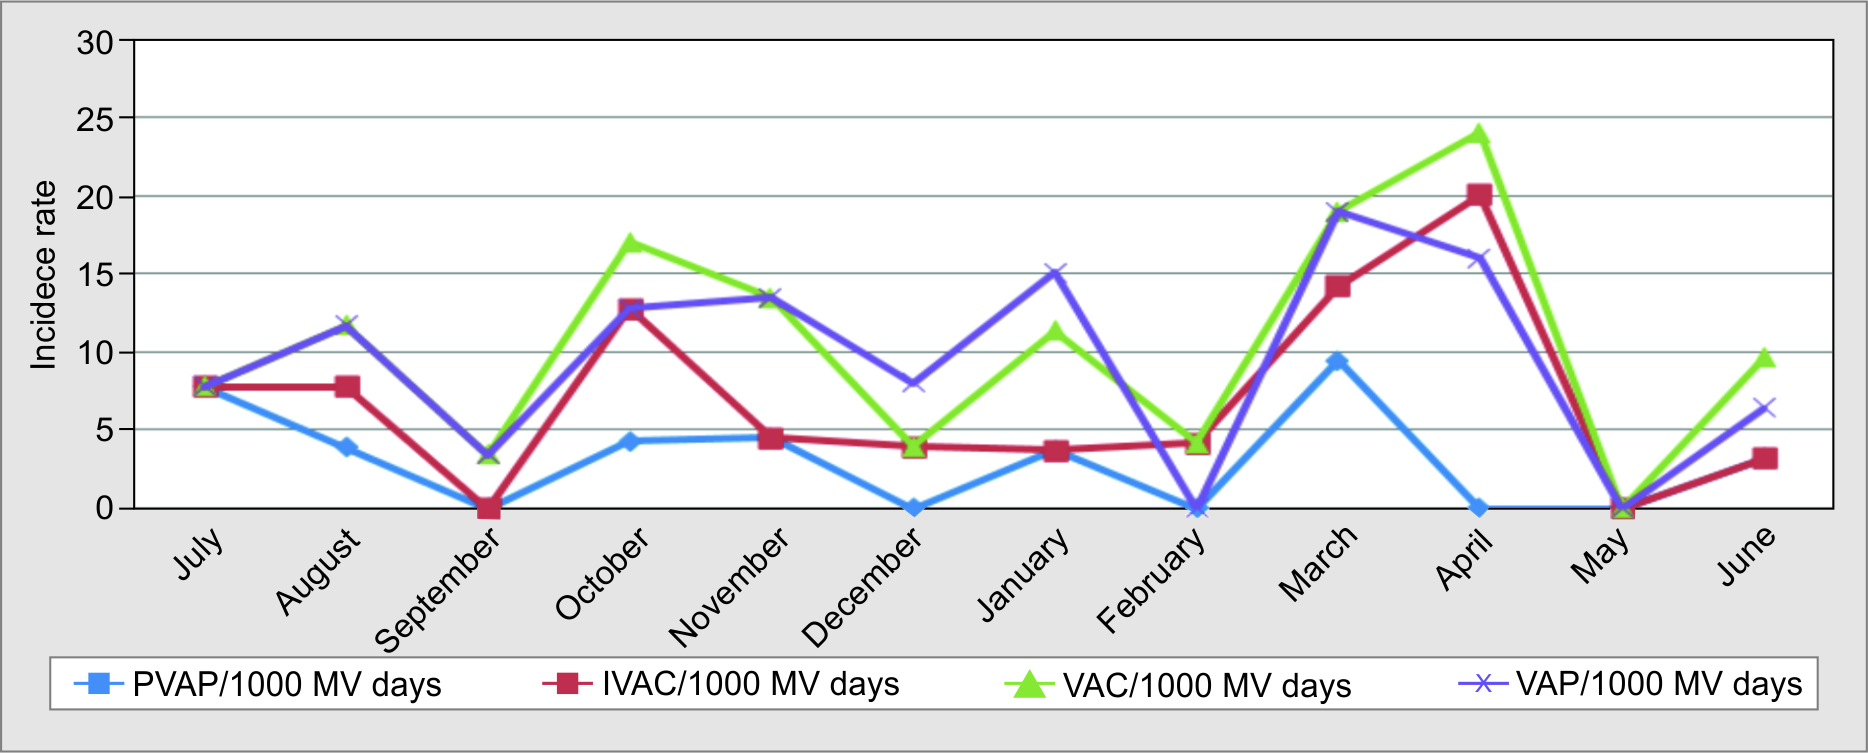
Fig. 1: Incidence rate of VAC, IVAC, PVAP and VAP from July 2018 to June 2019
The sensitivity, specificity, PPV, NPV, and accuracy of VAEs for VAP-NHSN diagnosis is shown in Table 4. In this study population, the agreement (Kendall’s coefficient for concordance) between VAP and VAC (0.005), VAP and IVAC (0.095), and VAP and PVAP (0.374) was poor.
| Sensitivity (95% CI) | Specificity (95% CI) | PPV (95% CI) | NPV (95% CI) | Accuracy (95% CI) | |
|---|---|---|---|---|---|
| VAC for VAP | 61.3% (42.2–78.2) | 97.4% (95.1–98.8) | 67.9% (51.1–81.0) | 96.6% (94.8–97.8) | 94.4% (91.6–96.5) |
| IVAC for VAP | 80.0% (56.3–94.3) | 96.7% (94.2–98.3) | 57.1% (42.4–70.8) | 98.9% (97.3–99.5) | 95.8% (93.2–97.6) |
| PVAP for VAP | 77.8% (40.0–97.2%) | 94.31% (91.4–96.4) | 25.0% (16.2–36.5) | 99.4% (98.1–99.8) | 93.9% (91.0–96.1) |
Most common pathogens isolated as a cause for VAP and IVAC in the patients included Acinetobacter baumannii, Klebsiella pneumoniae, Escherichia coli, Pseudomonas aeruginosa, Enterobacter spp., and Staphylococcus aureus (Table 5).
| Pathogens | No. of patients | AMK | MINO | CIPRO | CEFOTAX | IMI | PIP | CEFOSULB/ CSL | CEFTAZ/ CTZ | DOXY | MERO | ERTA | COL | CEFEP |
|---|---|---|---|---|---|---|---|---|---|---|---|---|---|---|
| Acinetobacter baumannii | 10 | 0 | 3 | 0 | 0 | 0 | 1 | 0 | 0 | 0 | 5 | 0 | ||
| Klebsiella pneumoniae | 7 | 4 | 1 | 2 | 1 | 1 | 2 | 2 | 1 | 3 | 1 | |||
| Escherichia coli | 3 | 2 | 1 | 0 | 0 | 1 | 1 | 1 | 0 | 0 | 1 | 0 | 3 | 0 |
| Pseudomonas aeruginosa | 2 | 2 | 2 | 2 | 2 | 2 | 2 | 2 | 2 | |||||
| Enterobacter Spp. | 2 | 2 | 1 | 2 | 0 | 0 | 0 | 0 | 0 | 0 | 0 | 0 | 1 | |
| Methicillin resistant staphylococcus aureus |
2 | 0 | ||||||||||||
| No. of patients | TIG | GENT | TETRA | LEVO | CHL | VANCO | TEICO | SAM | LNZ | CLIND | OXA | ERYTHRO | ||
| Acinetobacter baumannii | 10 | 4 | 0 | 2 | 1 | 1 | ||||||||
| Klebsiella pneumoniae | 7 | 1 | ||||||||||||
| Escherichia coli | 3 | 2 | ||||||||||||
| Pseudomonas aeruginosa | 2 | 2 | ||||||||||||
| Enterobacter Spp. | 2 | |||||||||||||
| Methicillin resistant staphylococcus aureus |
2 | 2 | 2 | 1 | 1 | 0 | 0 | |||||||
DISCUSSION
VAE surveillance has not been widely adopted beyond the United States. One of the reasons may be that there exists uncertainty about the overlap between VAP and VAE, thereby with implications of the same on clinical utility. We sought to determine the accuracy of VAC for the diagnosis of VAP and vice versa in a setting of trauma ICU in our tertiary care hospital in India.
As previous studies have also reported,6,7 we found a higher incidence of VAC compared to VAP (10.2 vs 9.2 per 1000 MV days). However, the incidence of VAP was more than IVAC (6.6/1000 MV days) and much higher than PVAP (2.97/1000 MV days). Here was therefore a poor concordance of VAP with VAC (0.005), IVAC (0.095), and PVAP (0.374) in our patients. The PPV of VAC and IVAC for VAP-NHSN was 67.9 and 57.1%, respectively, while that of PVAP for VAP was only 25%. The sensitivity of VAC and IVAC for VAP-NHSN was 61.3 and 80.0%, respectively.
Table 6 lists the previous studies conducted to compare VAP and VAE in different study populations. The results of these studies also show poor relation between both definitions. V-associated event surveillance did not accurately detect cases of traditionally defined VAP in ICUs.
| Author, country | Study setting | Incidence of VAP/VAE | Sensitivity (%) of VAE to detect VAP | Specificity (%) | PPV (%) | NPV (%) | Conclusion |
|---|---|---|---|---|---|---|---|
| Piriyapatsom et al.,5 Massachusetts, USA | Retrospective, single-center, trauma subjects, IVAC compared to VAP | IVAC or VAP 35.6 VAP 29.6% Both 8.3% |
IVAC 28.12 | 91.45 | 58.06 | 75.14 | IVAC criteria had a low accuracy for identifying VAP-NHSN in subjects with high-risk trauma |
| Klouwenberg et al.,6 Netherlands | Prospective cohort study in two Dutch academic medical centers | VAC 10/1000 MV days IVAC 4.2 VAE–VAP 32. VAP 8.0/100 MV days |
VAC 33% IVAC 17% |
Noted much poorer concordance between the novel VAE algorithm and VAP. The incidence rate of VAC, IVAC, VAE-VAP, and VAP in the present study was comparable (10.23, 6.60, 6.26, and 9.24, respectively). Poor concordance noted between VAP and VAE in the present study too | |||
| Fan et al.,7 Wuhan, China | Meta-analysis of 18 studies | VAC 10.23 IVAC 6.6 Possible VAP 2.97 VAP-NHSN 9.24/1,000 MV days |
VAE <50% | >80% | <50% | >80% | VAE surveillance missed many cases of VAP, and the population characteristics identified by the two surveillance paradigms differed |
| Boyer et al.,8 St Louis, Missouri | Prospectively surveyed 1,209 patients ventilated for 2 calendar days at medical surgical ICU | VACs 5.5% (7/1,000 MV days) IVAC 3.6/1,000 MV days VAP 10.0/1,000 MV days |
VAC 25.9% | VAC criteria captured a minority of VAP episodes | |||
| Meagher et al.,9 USA | Retrospective study, adult trauma patients (2012–2017) | VAE 8.1% VAP 7.4% and Both 4.1% of patients |
The proportions of individual entities were found to be comparable to the present study for VAC (8.2%), VAP (7.41%), and VAE + VAP (5.02%) | ||||
| Younan et al.,10 China | Retrospective study, trauma patients | “New” VAP 6.6% “Old” VAP 30.9% Both 5.8% |
The concordance between new and old definitions was poor (kappa 0.22), similar to the present study |
As the study was conducted in trauma intensive care, the majority of the cohort comprised severe head injury. In such patient profile, it may be worth noting that certain trauma-related factors like depressed consciousness, loss of protective reflexes, reduced muscle strength, and delayed presentation may contribute to higher infectivity and mortality.
COMPARISON OF CHALLENGES FACED DURING VAP AND VAE SURVEILLANCE
To meet VAP definition, subjective criteria [amount of endotracheal (ET) secretions, change in character of ET secretions, progressive/new and persistent X-ray changes] are applied, which for some patients, clinicians and surveillance team might find difficult to agree on. Ventilator-associated event is more objective, easy to use, and has less chances of disagreement on case definition. However, there is a strict definition for window period in VAE which sometimes excludes some cases if the definition criteria meet ± few days of that period. For example, if a tracheal aspirate (TA) culture has come positive 1–4 days before worsening PEEP/FiO2, clinicians sometimes do not repeat the TA for surveillance purposes. Our study found a low concordance found between VAP and VAE (including VAC, IVAC, and PVAP). It is possible that the new VAE definitions are missing out on the patients who would fit into VAP criteria.
Klompas and Berra11 found that a screening ventilator setting for VAC captures a similar set of complications to traditional VAP surveillance but is faster, more objective, and superior predictor of outcomes. Klompas and Berra also analyzed pros and cons of VAE. They added that VAE surveillance has the potential to catalyze better care and to help hospitals track outcomes in ventilated patients more rigorously and more efficiently. On the con side, the complete VAE definition set with sub-tiers is complicated, neither sensitive nor specific for VAP, non-physiological compared with other ICU metrics, susceptible to gaming, and may bring about changes in clinician behavior that could paradoxically end up harming patients.
Yu et al.12 studied 71 patients with VAP and coined a new term called “gradual VAP.” They added that “it is challenging for the clinician to make a diagnosis of pneumonia without chest imaging, leading to the fact that the IVAC definition is mainly used in surveillance. Thus, it is a challenge to determine the timing of the initiation of antibiotic treatment. Gradual VAP is a novel concept that might be a better bridge to link VAT and VAP than IVAC.”
LIMITATION OF THE STUDY AND FUTURE AREAS OF WORK
There are many extraneous variables that may have affected the incidence of VAP and VAC. First, the majority of patients in trauma ICU reach ICU after an average 2–3 days stay in emergency. Some of the patients even get initial first aid or sometimes get endotracheal intubation done at the local hospitals. The condition in which the initial intubation done and the care taken post intubation affects the chest status of patients. Second, patients in trauma ICU sometimes have conditions like fracture of ribs, hypoventilation, pneumothorax, aspiration, etc. These patients have higher chances of deteriorating post ventilation. So, it would be worthwhile to conduct studies to evaluate the role of these factors in this patient population in the future.
CONCLUSION
As a surveillance definition, VAC, IVAC, and PVAP have poor concordance with VAP-NHSN. Many extraneous factors as mentioned in the limitations in the study might have contribution to the change in trends. More studies are needed to study the role of pre ICU intervention factors in this population.
ORCID
Kulbeer Kaur https://orcid.org/0000-0002-6502-6530
Kajal Jain https://orcid.org/0000-0003-3077-8326
Manisha Biswal https://orcid.org/0000-0003-2016-3678
Surinder Kaur Dayal https://orcid.org/0000-0002-8810-524X
REFERENCES
1. Rello J, Olledorf DA, Oster G et al. Epidemiology and outcomes of ventlaoilrt-associated pneumonia in a large US database. Chest 2002;1226(2):2115–2121. DOI: 10.1378/chest.122.6.2115.
2. Cook A, Norwood SBJ. Ventilator-associated pneumonia is more common and of less consequence in trauma patients compared with other critically ill patients. J Trauma 2010;69(5):1083–1091. DOI: 10.1097/TA.0b013e3181f9fb51.
3. Michetti CP, Fakhry SM, Ferguson PL et al. Ventilator-Associated Pneumonia Investigators. Ventilator-associated pneumonia rates at major trauma centers compared with a national benchmark: a multi-institutional study of the AAST. J Trauma Acute Care Surg 2012;72(5):1165–1173. DOI: 10.1097/TA.0b013e31824d10fa.
4. Magill SS, Li Q, Gross C et al. Incidence and characteristics of ventilator-associated events reported to the National Healthcare Safety Network in 2014. Crit Care Med 2016;44(12):2154–2162. DOI: 10.1097/CCM.0000000000001871.
5. Piriyapatsom A, Lin H, Pirrone M et al. Evaluation of the infection-related ventilator-associated events algorithm for ventilator-associated pneumonia surveillance in a trauma population. Respir Care 2016;61(3):269–276. DOI: 10.4187/respcare.04280.
6. Klouwenberg PMCK, Van Mourik MSM, Ong DSY et al. Electronic implementation of a novel surveillance paradigm for ventilator-associated events feasibility and validation. Am J Respir Crit Care Med 2014; 15;189(8):947–955. DOI: 10.1164/rccm.201307-1376OC.
7. Fan Y, Gao F, Wu Y et al. Does ventilator-associated event surveillance detect ventilator-associated pneumonia in intensive care units? A systematic review and meta-analysis. Crit Care 2016; 24;20(1):338. DOI: 10.1186/s13054-016-1506-z.
8. Boyer A Schoenberg N Babcock H et al.A prospective evaluation of ventilator-associated conditions and infection-related ventilator-associated conditions. Chest 2015;147(1):68–81. DOI: 10.1378/chest.14-0544.
9. Meagher AD, Lind M, Senekjian L et al. Ventilator-associated events, not ventilator-associated pneumonia, is associated with higher mortality in trauma patients. J Trauma Acute Care Surg 2019;87(2):307–314. DOI: 10.1097/TA.0000000000002294.
10. Younan D Griffin R Swain T et al.Disease control and prevention’s definitions for ventilator-associated pneumonia had worse outcomes than those meeting only one. J Surg Res 2017;216:123–128.
11. Klompas M, Berra L. Should ventilator-associated events become a quality indicator for ICUs? Respir Care 2016;61(6):723–736. DOI: 10.4187/respcare.04548.
12. Yu Y, Zhu C, Liu C et al. How to remove the grey area between ventilator-associated pneumonia and ventilator-associated tracheobronchitis? Crit Care 2017;21(1):165. https://doi.org/10.1186/s13054-017-1754-6.
________________________
© The Author(s). 2022 Open Access This article is distributed under the terms of the Creative Commons Attribution 4.0 International License (https://creativecommons.org/licenses/by-nc/4.0/), which permits unrestricted use, distribution, and non-commercial reproduction in any medium, provided you give appropriate credit to the original author(s) and the source, provide a link to the Creative Commons license, and indicate if changes were made. The Creative Commons Public Domain Dedication waiver (http://creativecommons.org/publicdomain/zero/1.0/) applies to the data made available in this article, unless otherwise stated.